Opportunities
Opportunities answers one question: where do you put your next unit of effort to move engagement and retention, and how much can you trust that call?
It is a place to decide what to do next, not a dashboard to interpret. Instead of a wall of charts describing how your catalog is doing, it hands you a ranked worklist of specific bets to make, each written in plain language and tagged with how much evidence stands behind it.
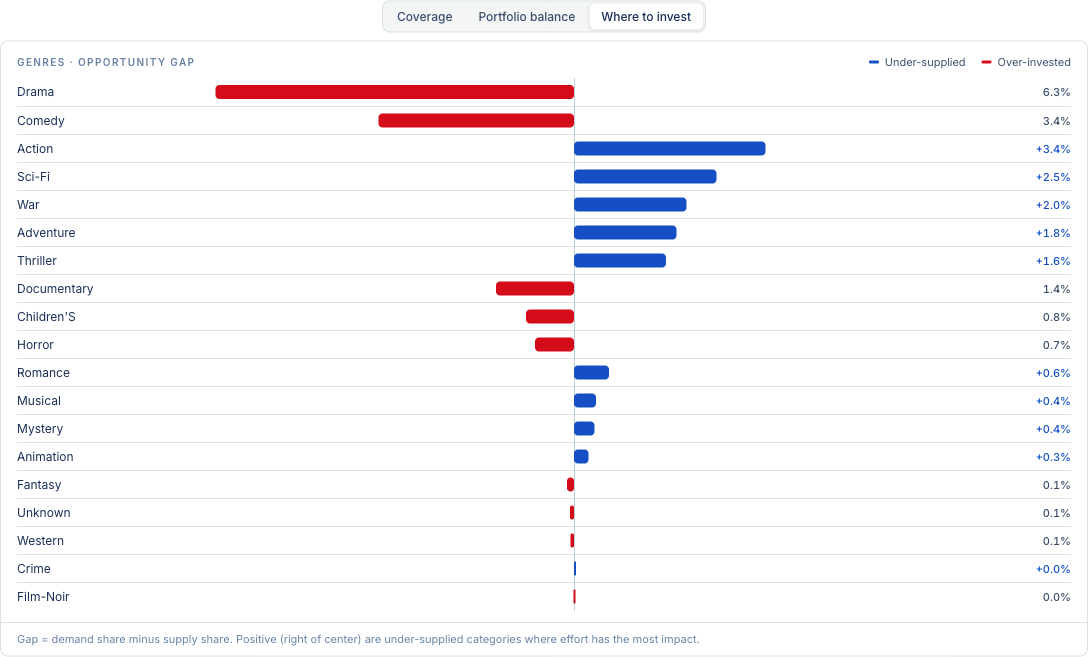
The default view: each category ranked by its supply/demand gap. This example is a MovieLens catalog, where the platform derived "Genres" as the organizing category on its own.
The idea in one picture
Every opportunity comes from comparing two things the platform can see together:
- Supply — what you have made. The size of your catalog in each category.
- Demand — what people actually engaged with. The behavior against that catalog.
Line those up side by side and the gaps tell you where to act:
- Demand is outrunning a thin shelf → make more there.
- A big shelf is barely pulling → move that effort somewhere it is needed.
- You promised a category and carry nothing → start covering it.
- Content people rely on has gone stale → refresh it.
That comparison is the whole engine of the tab. Everything else — the headlines, the charts, the trust labels — is a way of reading it.
A worked example
For a wellness content library, the worklist might surface:
- Commission more sleep content. Sleep pulls 2.4× the typical engagement on only 12 articles.
- Rebalance nutrition. 47 nutrition articles, each drawing under half the typical pull.
- Establish a hydration shelf. You market six wellness pillars; hydration has zero articles and four audiences focus there.
Each of those is one row in the list, sorted so the highest-leverage, best- evidenced bets are at the top.

A quick read at the top of the tab: how many gaps are open, how many to act on this cycle, how many categories were read, and how much behavior the whole thing rests on.
What it is deliberately not
- Not a performance report ("how did sleep content do"). That is analytics.
- Not a per-item view ("which article underperformed"). That is the catalog browser.
- Not an engine-quality view ("is the recommender ranking well"). That is the Engine space.
It sits above all three and answers only: given what those know, what should I make or fix next, and how sure are we.
Where the data comes from
You do not configure any of this. When your data is connected and analyzed, NEXTGRES works out on its own which tables are your catalog, which columns are meaningful categories, and which stream is real user behavior. Opportunities reads that analysis and builds the worklist from it. A category you have never labeled and a catalog we have never seen still produce a correct worklist the moment analysis finishes.
When the data cannot support something, the tab hides it honestly rather than faking it. If there is no way to prove a real user interaction, you will not see a "Measured" badge; if there is no category to organize around, the tab says so instead of showing an empty grid.
Next
- Reading the worklist — bands, headlines, and the kinds of opportunity.
- Trust labels — what Measured, Limited, Inferred, and Modeled mean, and why a guess can never top the list.
- The overview charts — the gap, balance, and coverage views.