The overview charts
Above the worklist sits an overview that shows the supply-and-demand picture the opportunities are drawn from. You can switch between three views. They are three ways of looking at the same comparison, not three different datasets.
Where to invest (the default)
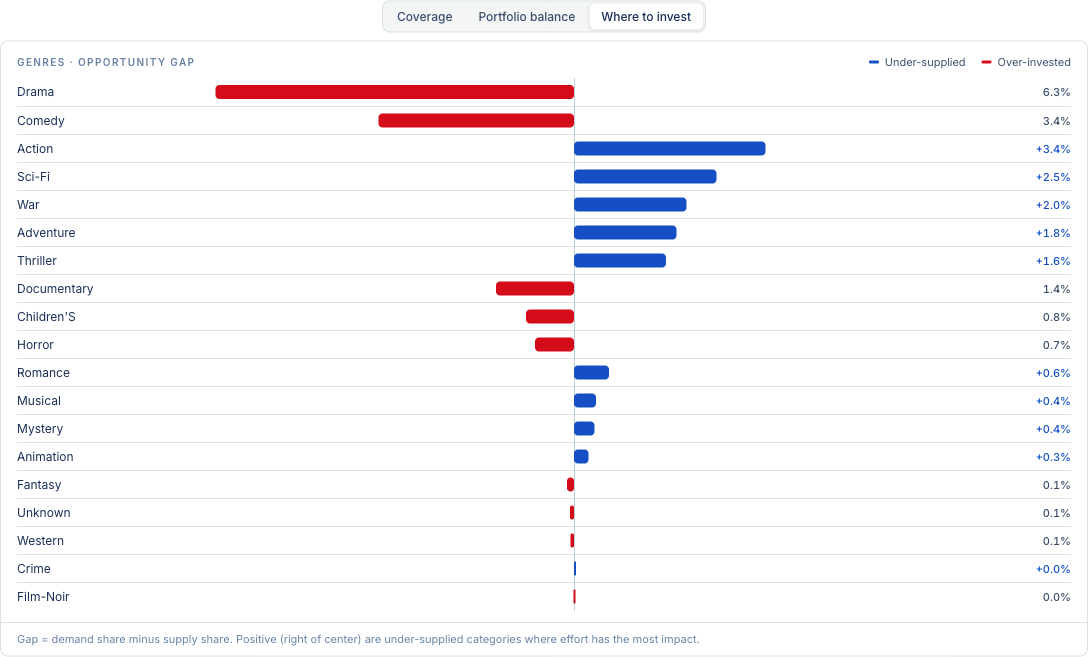
The default view. A diverging bar chart of the gap in each category, where
gap = demand share − supply share.
Categories that lean one way are under-supplied: people want more than you carry, so effort there has the most leverage. Categories that lean the other way are over-invested: you carry more than the demand justifies. Reading the biggest bars from the center outward is the fastest way to see where to move effort.
Portfolio balance
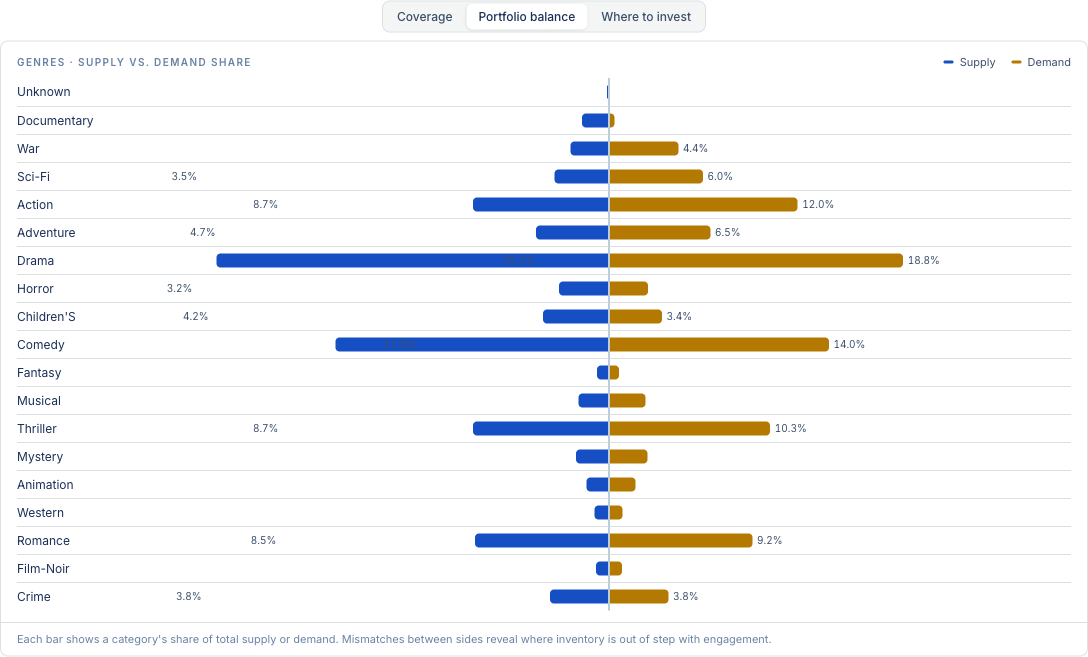
A side-by-side (butterfly) view: for each category, supply on one side and demand on the other. Where the two wings are lopsided, supply and demand are out of balance. Use this when you want to see the raw shape of the catalog against behavior, rather than the net gap.
Coverage
A grid of your content types against your categories, showing where you have solid coverage, thin coverage, or none at all. When counts are available it renders as a heatmap so intensity shows depth at a glance; otherwise it shows each cell's state (present, thin, absent, untracked). This is the view for spotting holes — a category with an empty row is a shelf you promise and do not carry.
Which one shows first
The tab opens on Where to invest, because the gap is the most direct answer to "where should I act." The other two are one click away. On catalogs with many categories and content types, the coverage grid is often the more revealing starting point, and the tab will favor it when the data is shaped that way.